
How to Read Trends: Crypto Chart Analysis

Understanding crypto charts is an important skill for cryptocurrency traders and investors alike. Yet, analyzing trading patterns comes with many technical terms that may be intimidating to beginners. Don’t worry though, because today, we will cover all the basics of Bitcoin trading patterns, altcoin charts, and much more. Then, we’ll show you how to put your newfound knowledge into action.
How to read trends: bulls vs. bears
Before we get into the thick of crypto chart analysis, let’s first get into the battle of the bulls vs. the bears. In both traditional and cryptocurrency markets, you’ll see analysts referring to these two groups. Don’t worry. They are not actual bulls and bears fighting each other. Instead, bulls and bears are two types of market participants with varying levels of market sentiment.
Bulls represent positive sentiment in the market. Bears represent the negative side. When someone says there is a “bullish movement” that represents a positive, upward movement on the market. A “bearish movement” represents a negative, downward movement. Bulls are buyers and bears are sellers.
The Dow Theory: the key to understanding crypto charts
Another key element of understanding crypto charts is understanding the Dow Theory. Charles Dow first developed The Dow Theory, the same man behind the Dow Jones Industrial Average stock market index. The Dow Theory consists of six main principles:
1. There are three basic movements of markets.
2. There are three phases of market trends.
3. Market prices reflect all news.
4. Financial market indexes need to agree with each other.
5. Volume confirms market trends.
6. Strong signals verify market trend reversal.
These principles are worth digging deeper into. But for the sake of crypto, let’s focus on a few of them for now.
What are the three movements of the crypto market?
The first principle of the Dow Theory states there are three movements of the crypto market and all markets for that matter:
1. The first movement is the main movement. It’s a big trend and can last for many months to many years. This trend can be either bullish or bearish.
2. The second movement is a medium swing trend. This is a reactionary trend that can last ten days to three months and can retrace from the start of the main movement.
3. Then, there is the short swing. The short swing is a minor movement that varies in length depending on market speculation and can last hours or weeks.
What are the three phases of the crypto market?
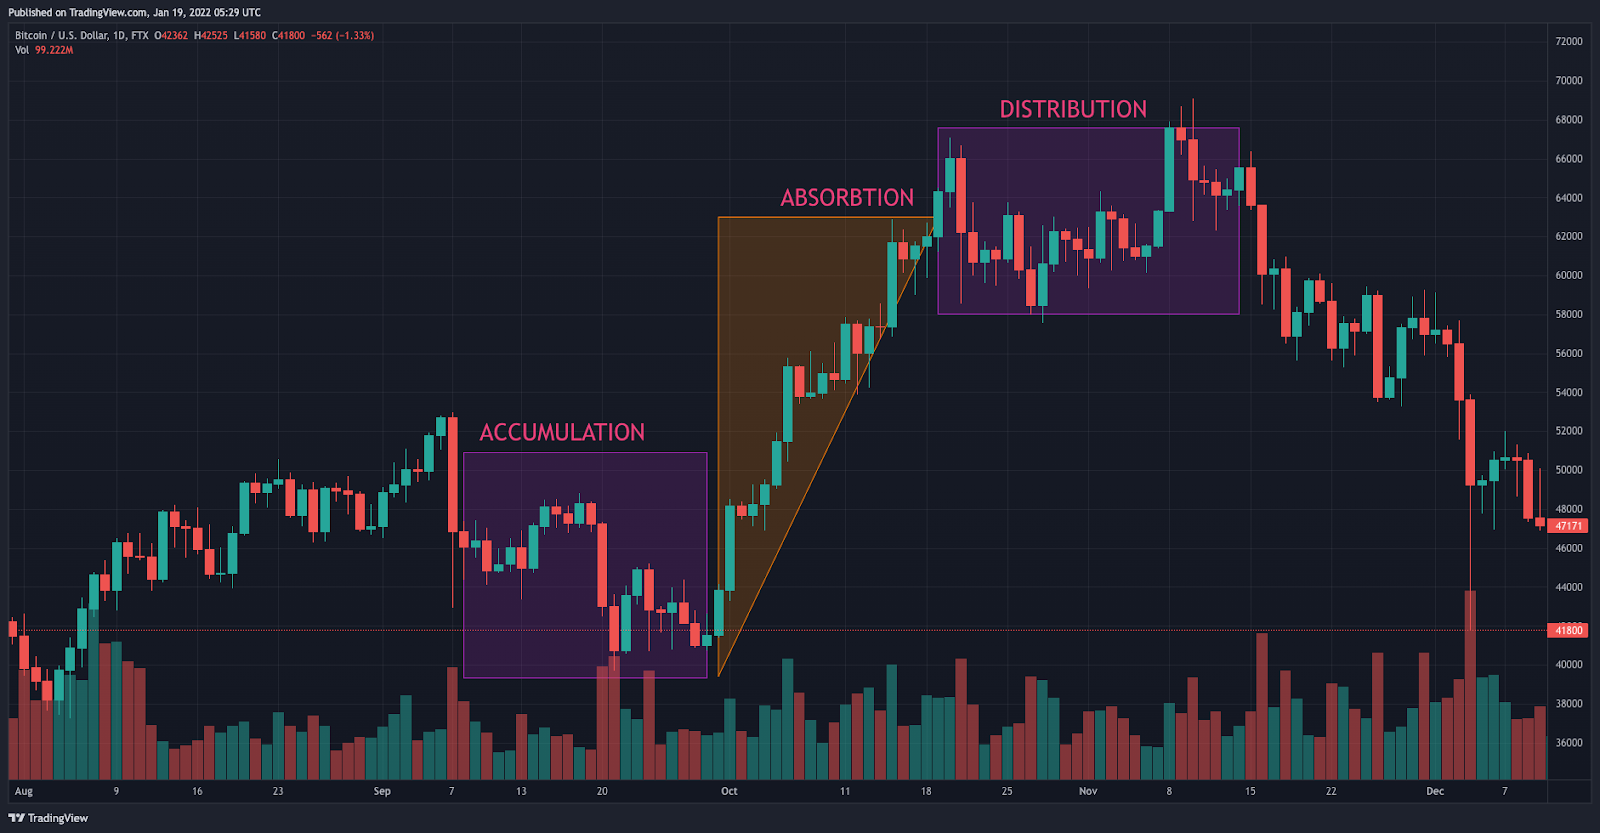
Now that we know the three movements found in markets, let’s examine the three phases known as accumulation, absorption, and distribution (AAD).
Phase 1 (accumulation): The accumulation phase is the time when “smart money” investors – or those with deep market knowledge – begin to buy or sell a certain asset. This is significant because they are doing so against the attitude of the market. For example, if the majority of the market is selling, then the smart money investors start accumulating assets. If the majority buys, then smart money investors sell their assets and accumulate profit.
Phase 2 (absorption): The market starts to realize what these smart money investors are doing, and then follow their trend. This is when phase two starts and public participation in the next trend beings.
Phase 3 (distribution): After phase two creates large-scale speculation, the asset experiences supply shock. Then, the smart money investors begin to distribute their holdings to the rest of the market. The volume falls and so do prices.
So how do these "smart money" investors predict when these phases will occur? Do they have access to insider trading tips we don’t know? Well, not exactly. These investors know how to read trends. That doesn’t mean they are always correct but using technical analysis, traders can predict a likely outcome for a given cryptocurrency, stock, etc.
How to read trends with technical analysis
As stated earlier, a major principle of the Dow Theory is that trends will continue to exist until a confident signal proves otherwise. While that’s great and all, how does one predict ahead of time when this definitive signal occurs? Technical analysis helps with that.
Technical analysis is a method used to predict the future price movement of an asset. In crypto, technical analysts read trends on crypto charts that take place over a trading period (e.g. five minutes, one day, one week, one month, etc.). In general, each period shows many data points highlighting a low price, high price, and everything between. When reading crypto charts, traders mainly use three different types: Line, bar, and candlestick (shown below). There are more types, but these are the most popular
The three types of charts

A line chart is the most basic type of crypto chart. It is a single line that connects all cryptocurrency prices during the chosen time interval. While it’s an easy chart to follow for beginners, it lacks detail. Yet, it’s still good for analyzing the overall trend.

A bar chart is a bar that grows or shrinks from one bar to the next. If the market is volatile, the bar grows as the price swings. If the market is quiet, the bar shrinks into a smaller size.
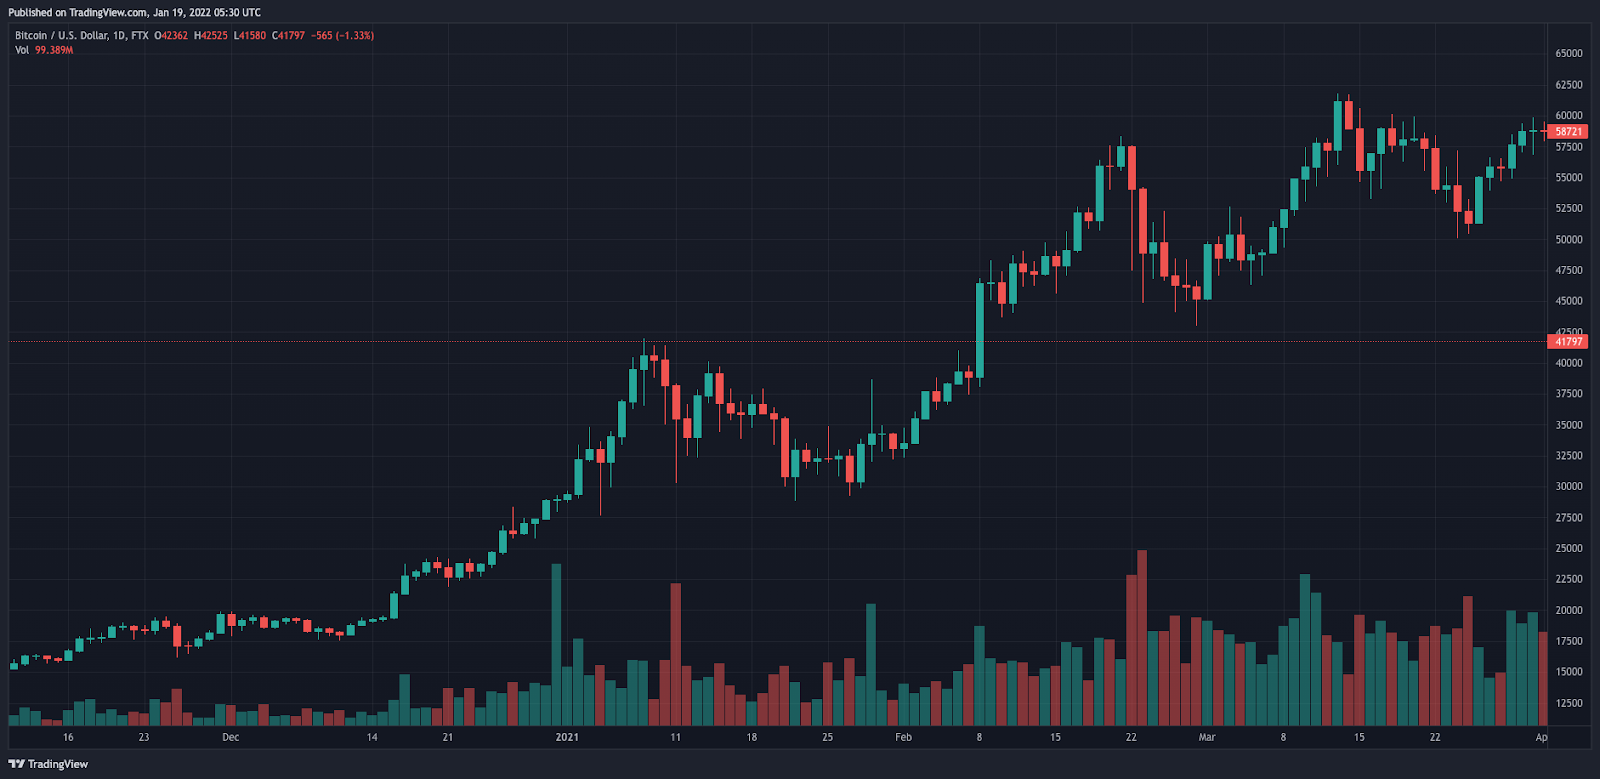
The most popular chart is the candlestick chart. This is a more advanced variation of the bar chart but uses two colors (red and green) to symbolize whether the price closed at a higher or lower level than the previous period. During bull markets, you’ll see a majority of green candlesticks. During bear markets, you’ll see a majority of red candlesticks.
Crypto chart analysis: support vs. resistance
The type of crypto chart you choose is up to you. Technical analysis is like art. There is no right or wrong way to go about it. You need to experiment and see what strategy works best for you. Yet, there are key elements of technical analysis one must always follow. For example, it’s essential to learn to spot support and resistance.

Support is the bottom of a cryptocurrency’s price. Here, a bearish cryptocurrency stops falling, consolidates, and reverses direction. Support is when the bulls (buyers) take control.
Resistance is the total opposite of support. This is the ceiling of a cryptocurrency’s price where it stops moving to higher highs and then reveres direction. At resistance, the bears (sellers) take over and push the price down to get that crypto at lower prices. If the bulls want to blast through the resistance, they need to overpower the bears.
Please note that support and resistance are psychological levels. They are not hard lines that force the price to behave. Support and resistance levels are often broken and violated by several factors. Yet, knowing where support and resistance levels exist is important for traders to gauge buying and selling points, even if they are not correct 100% of the time.
Crypto trading pattern basics: reversals and breakouts
When learning the elements of crypto chart analysis, you’ll start to recognize patterns. These patterns are very useful in reading where a trend begins and ends. That way, you can time your entry and exit points more. This is beneficial for both long-term HODLers and day traders.
Think about it. Imagine if you timed your exit towards the peak of the last cycle, only to use all those profits to buy the bottom of the following bear market? There is a ton of profit potential in learning trends, so here are a few well-known patterns to keep an eye out for.
Ascending Triangle

Descending Triangle

Pennant

Bearish Flag

Bullish Flag

Remember to always look for confirmation in the chart pattern. Confirmation occurs when there is at least one higher high (or lower lower) than the first and one higher low (or one lower low) than the previous price on the previous trend.
Understanding the process of crypto chart analysis
We hope you enjoyed this introductory article on how to read trends. It may seem overwhelming at first. That’s ok. Remember, learning how to master the market is a process. It takes patience. Yet, when you learn how to spot trends, you’ll uncover the power of financial freedom and join the crowd of “smart money investors.”
Use Multi HODL to play with your newfound skill
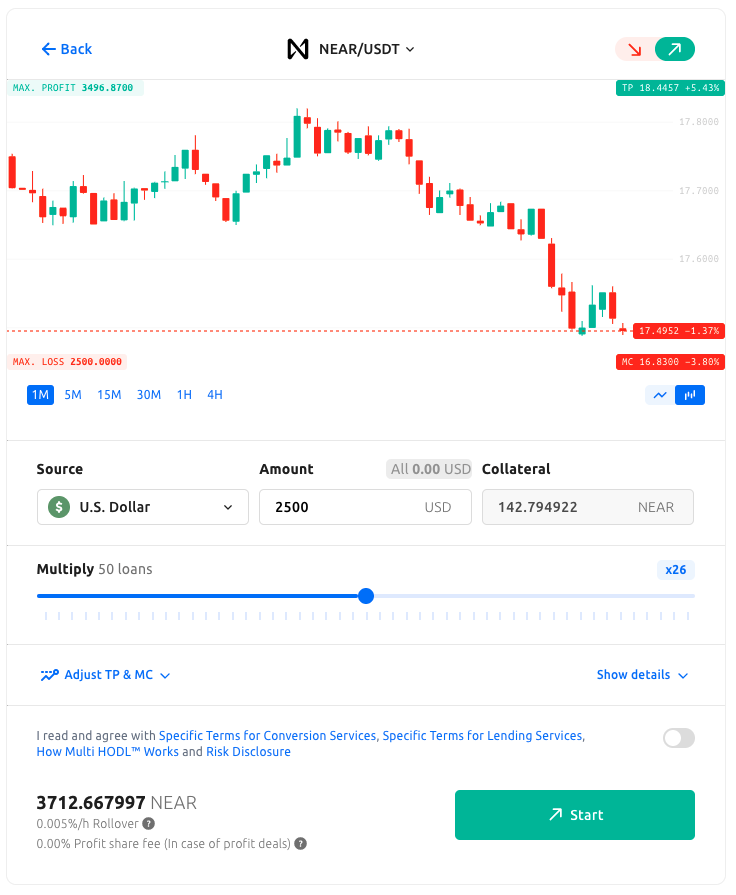
Multi HODL is a unique trading tool on YouHodler that lets traders play with the crypto market. Whether the market moves up or down, Multi HODL allows you to profit from this volatility. Now that you know how to read trends, you can try out your skills in real-time and make adjustments as needed.
Multi HODL lets you choose how much you want to trade, so you can start small and work your way up. Experiment with different risk management strategies, over 30 crypto coins, and more. Every day, there are market opportunities. It’s up to you to find them and profit from them. Multi HODL helps you with this. So give it a try today.


YouHodler ist in der Schweiz und in der EU reguliert
Partnerschaft mit regulierten EU-/Schweizer Zahlungsanbietern
YouHodler S.A. Regulated Financial Intermediary and Pawn Broker
OAM-Registrierung von YouHodler Italy S.R.L.
VASP-Registrierung bei der Bank von Spanien